Pictured below is the Signatrol RC-51T USB temperature data logger with LCD display.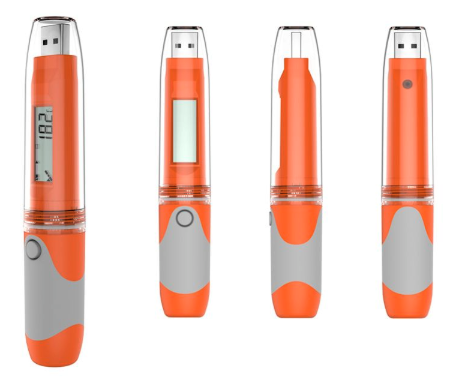
This logger will record temperatures in the range -30°C to +70°C with ±0.5°C accuracy between -20°C to +40°C, a resolution of 0.1°C, and a sample rate settable from 10 seconds to 24 hours. Up to 32,000 readings can be stored in memory corresponding to just under 90 hours of temperature logging with a 10 second sample rate or almost 90 years with a 24 hour sample rate.
The RC-51T is powered by a user-replaceable ER14250 3.6V lithium battery (1/2 AA sized) which should give around 12 months of data logging. (Buy ER14250 batteries here from around £3 each.)
The device is IP65 rated so can be safely used outdoors, but not submerged in water.
The RC-51T is very well made. It is very robust – solid and heavy. The screw on cap is also strong and screws on tightly to maintain a rain and splash-proof seal. The quick start guide instruction sheet is more than enough to get up and running with this data logger which is good as there do not appear to be any more detailed instructions available.
Software
Before plugging this data logger into your PC the first time, you must download and install the operating software from http://www.signatrol.com/rc51. This software is used to set up the data logger as well as to view the data stored on it. Previous saved data sets can be imported back into it and viewed even when the data logger is not plugged into the PC.
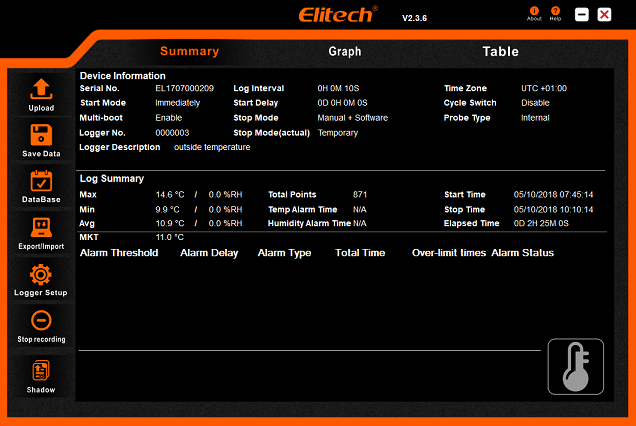
The operation software is a bit dated and slow in places (particularly when graphing data or scrolling through pages of data), but it is functional enough to do the job and it is intuitive to use.
When you plug the data logger into a PC, it automatically generates a printable PDF file summary of the data stored within it. This can be saved to the PC or opened directly from the USB device. Pictured below is one such example.
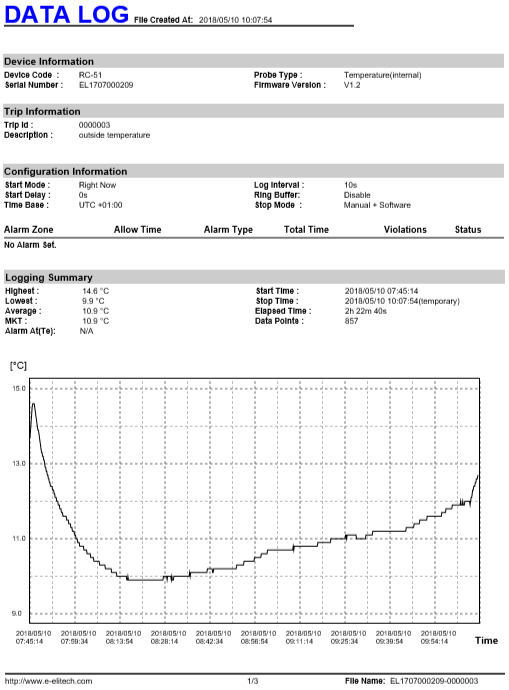
The configuration information is all detailed in addition to a summary of the data logged. This is followed by a graph showing the temperatures during the full logging period, and then subsequent pages in the PDF file have tables of every temperature data point recorded together with its real time and date timestamp.
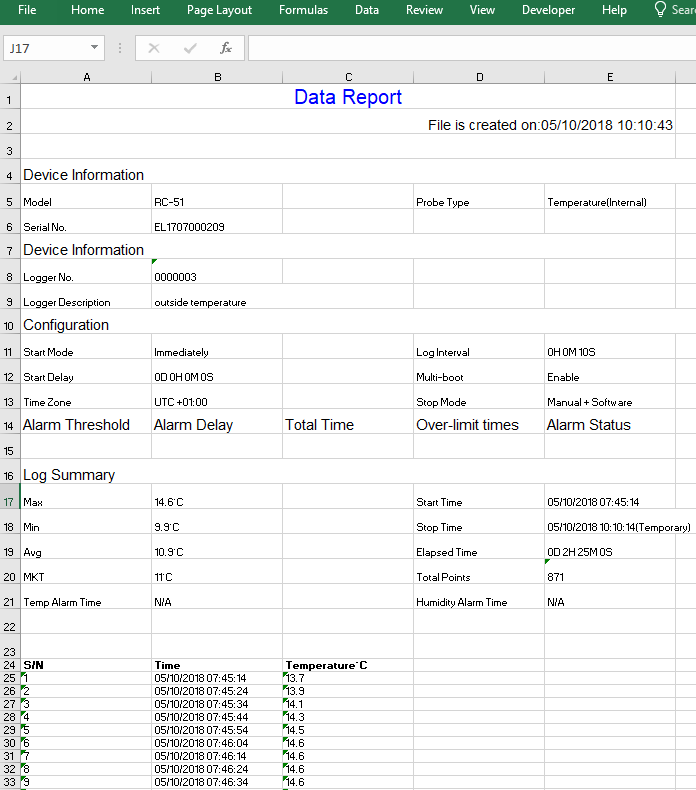
If you have the operation software open, you have the choice to export the stored data as an Excel file which gives you all the same information as the PDF file, but the ability to use the power of Excel to take the data and process it as you see fit.
ELT format files are generated by the software and stored on your PC (accessible via the Database button in the software). These files can be exported so that you can save and back them up externally and import them to the software at a later date if required – e.g. if you use two or more different PCs or if you want to send data to someone else to look at. You can also export the stored data in AI format as well as Excel format as mentioned above.
All the settings you use to configure the data logger such as sample rate, time to start, time to stop, etc, can be saved onto your PC for future use – handy if you have multiple loggers to set up.
Data transfer between the logger and the PC can be slow depending on how full the data log is. The automatic generation of a PDF summary of the stored data takes around 8 seconds for an almost empty log up to 2-3 minutes for a full (32,000 records) log.
Unfortunately during this PDF generation time, the device is ‘not connected‘, so you cannot upload the data from USB data logger to the software to view it while waiting for the PDF file (which you may not want anyway).
Data Logger Display and Interface
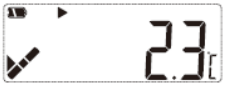
The display and the button on the data logger body are used to show the status of the data logger as well as some different measurements: current temperature, number of readings taken, log interval (sample rate), mean kinetic temperature, average temperature, and the maximum and minimum temperatures measured since logging began.
In order to save power, the display only turns on when it is needed. Press the button once to turn it on and show the current temperature; then press the button again to manually cycle through the different information available. After 15 seconds of user inactivity, the display turns off again.
Having this display gives the user confidence that when they leave the data logger in place, they know that it is running, measuring temperature correctly, has sufficient memory space to hold the data to be collected etc.
Data Logger Uses
Although the RC-51T is sold primarily for commercial use (monitoring the temperature of goods in transit), there are many uses for it in the domestic environment made practical by its very low price and easy set up.
For example, this data logger can be put in the fridge or freezer (set up with a 15 minute sample rate for one year of operation) so that in the event of a power cut or the door being found left open, you can quickly check if there is a chance that your stored produce has spoiled. The display will show you the maximum recorded temperature, and if that is a bit higher than expected, further analysis of the data collected will show exactly when and for how long the fridge temperature was too high.
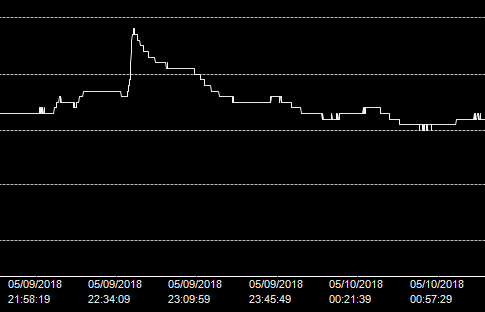 Pictured above is a graph showing a sudden rise in temperature (of approximately 1°C) when the fridge door was opened at 10:40pm, and how it took almost half an hour for the temperature of the fridge to get back down to its thermostatically set temperature of 5°C.
Alarms
High and low temperature warning alarms can be set up with the RC-51T – either single alarms which trigger immediately the temperature goes through a user-set temperature threshold, or cumulative alarms which only trigger after a user-set duration of the temperature being on the wrong side of a threshold.
Temperature Change Response Time
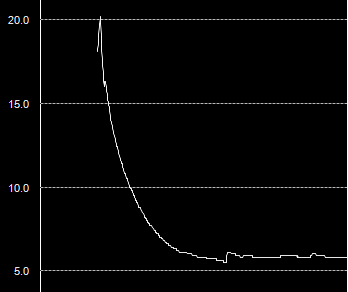
The response of the RC-51T to temperature change is quite slow. With the logger initially at 20°C we put it in the 5°C fridge. It took 15 minutes to get down to 10°C, and 39 minutes to get down to 6°C. This is because the sensor is built into a unit with quite a lot of thermal mass. (For a faster responding temperature data logger, you need to look at those with external temperature probes on leads.)
Conclusions
Overall, the Signatrol RC-51T is an easy to use, powerful product available at a reasonable £30-35 price. It and the associated software are reliable with a very short learning curve to get up and running data logging accurate temperature measurements. Click here to buy an RC-51T USB data logger now.
Further Information
For full details on the operation of this data logger, click here to view the RC-51T USB temperature data logger user manual (PDF).
Thank you to Signatrol who provided us with the sample unit. They supply a huge range of data logging devices primarily for the pharmaceutical and food transportation and storage industries.