All PV Solar Panels are affected by heat. The hotter the solar panel, the lower the power output – but how significant is the effect. We decided to test one of our small 6V 250mA Solar Panels to find out.

Reproducing the kind of temperatures solar panels experience in hot climates is not easy on a cloudy May day in the UK, so a 150 Watt halogen office lamp was used at a distance of 55mm from the solar panel as a sun substitute (see image above). This guaranteed a constant level of light would be incident upon the solar panel ensuring the quality of the results collected.
Measuring Voltage and Current Under Load
To measure the voltage and current under load, a power resistor was used across the positive and negative outputs of the solar panel. Previous experiments had shown us that the peak power output of these panels is obtained with a load resistance of around 56 Ohms.
Not having a 56 Ohm power resistor, a 33, 18, and 4.7 Ohm 5 Watt power resistor were connected in series to provide a measured resistance of exactly 55.8 Ohms (see above). The maximum power output of these panels under the halogen light was previously measured at around 750mW, so our 5W power resistors barely got warm.
Measuring Temperature Effect on Solar Panel
Taking voltage, current, and temperature readings manually at one second intervals would be impossible. We were expecting the temperature of the solar panel to increase very rapidly and we wanted the change in power output to be accuarately tracked. Therefore we used the Power Analyzer PRO from Medusa Products.
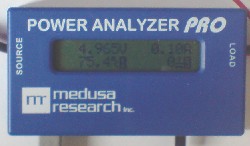
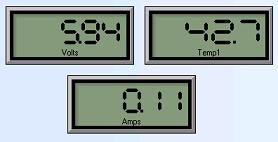
This device (pictured above) will measure the voltage and current flowing through the load to 0.005V and 0.01A accuracy, and also temperature to 0.1 degree Celcius accuracy with its probe. Readings are taken of all three values approximately four times every second. By connecting the Power Analyzer to a PC via the included USB cable, the results can be displayed and graphed in real time as well as being stored for later analysis.
Solar panels are very dark and so absorb a lot of light (and heat). Therefore the shiny silver coloured temperature probe was wrapped in a single layer of black insulation tape to increase its heat absorption. The temperature of the probe will not exactly match that across the whole surface of thesolar panel, however it should be close enough for the purposes of this experiment.
Running The Experiment
Everything was set up and the Power Analyzer initialised with the lamp turned off. When the lamp was turned on it took almost one minute to come to full brightness. Over the next 40 minutes the temperature measured by the probe (and therefore the solar panel) rose to a peak of 75 degrees Celcius. This is similar to the sorts of temperatures the solar panels at the Dubai Energy Tower will reach when that project is completed.
Experiment Results – How Does Temperature Affect Solar Panel Power Output
The graph above shows the relationship between temperature in degrees Celcius (horizontal axis) and the solar panel power output measured in milliwatts (vertical axis). Because of the way the halogen lamp took one minute to reach full brightness the results from 25-30 degrees Celcius should be ignored.
Between 30 and 42 degrees there was only a small drop in power output from a peak of 749 mW down to 730 mW. After that there was a consistent drop in power output of around 8.3mW (1.1% of peak output) per degree rise in temperature. Voltage under load went from a peak of 6.21V at 0.12 Amps down to just below 5V at 0.09 Amps.
The total power loss due to the increase in temperature was from around 750 mW down to just 458 mW – a fall of almost 40%! Had the solar panel been pre-cooled in the fridge before the experiment was started the peak power output would certainly have been even higher.
Comments
Did an interesting experiment yesterday concerning the loss of conversion efficiency of PVs as the surface temperature rises.
http://www.reuk.co.uk/Effect-of-Temperature-on-Solar-Panels.htm put me onto the idea after I’d been watching my charge current over the past week wondering why the output was not as high as last month. Or the month before.My array comprises five panels: two 120 watt, one 80 watt, two odd balls, for a total of about 400 watts. Mostly they lie flat on the roof of my bus.
During the Winter, even with the sun quite a few degrees lower than optimum at mid day the panels were doing better than 20A at their best. This past fortnight I’ve noted that as the sun comes up the output would climb as usual but never get to 20A. Leveled off at 16A or so.
What all sugars off is that at mid-day the surface temperature of the panels exceeds 130 degrees Farenheit (measured with a remote reading infrared thermometer) and the max output is about 16A. So what I did was to hose down the panels; the water cooled them to 100F and the output current went up to the usual better than 20A. (The meters only go that high and then they are against the peg.) As the panels rewarmed the current dropped. Repeated the cycle twice to confirm results. That’s about a 20% loss.
Alfred
3rd June 2010