Through any 24 hour period, the amount of carbon released into the atmosphere per unit of electricity generated fluctuates widely. At night time when the demand for electricity is low, nuclear and efficient gas power stations can meet our energy needs. During the day however when demand jumps, the wholesale price of electricity increases and it becomes economically viable to switch on less efficient power stations – primarily coal burning – to generate electricity.
As demand for electricity increases, so the polluting effect per unit generated increases. Electricity generated in winter when more heating and lighting is required, and electricity generated during the day and evening is more polluting than electricity generated in the summer or at night.
Tracking Carbon Intensity
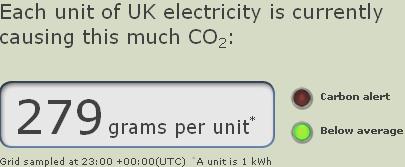
A new website has been launched called Realtime Carbon which displays an approximation of the current carbon intensity measured in grammes of CO2 per kWh unit of electricity generated. In order to calculate this value, current electricity generation by different fuel types is measured. The carbon emissions for oil, gas, coal, and other power stations are known, and so the overall carbon cost of electricity generated at any particular time can be calculated quite accurately in near real time.
Why is this information useful? Knowing the true carbon cost of using electricity enables people to make better decisions about their electricity usage – for example, running the dishwasher, washing machine, and tumble drier at night instead of in the evening. Using the XML feed data from the realtime carbon website, it could even be possible to set appliances to come on (or turn off) depending on the carbon cost of electricity!
Electricity Generated by Fuel Type
The BMRS (balancing mechanism reporting system) website provides near real time (and historical) data of the balancing mechanism which is used by the National Grid to balance electricity supply and demand. An XML feed (updated every 5 minutes) of instantaneous generation by fuel type can be viewed by clicking here. Pictured below is part of an example feed.
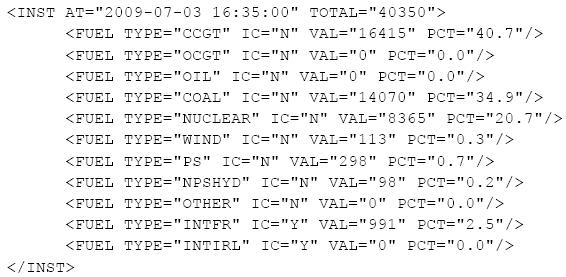
This feed can be interpreted as follows: At 16:35 on 3rd July 2009, the total power being generated was 40.350GW. For each fuel type the amount of power being generated, and its percentage of the overall is shown – e.g. 40.7% came from CCGT (closed cycle gas turbine), 34.9% from coal, 20.7% from nuclear. OCGT stands for open cycle gas turbine, PS is pumped storage, NPSHYD is non pumped storage hydro, and INTFR and INTIRL are international imports from France and Ireland respectively.
Conversion Factor
Knowing how much electricity is being generated by each fuel type gives half of the solution. The other half comes from the CO2 conversion factor – the amount of CO2 released (in Kg) per kWh of electricity generated. The Realtime Carbon website use the following conversion factors:
| 0.360 Closed cycle gas turbines (CCGT) 0.479 Open cycle gas turbines (OCGT) 0.910 Coal 0.016 Nuclear 0.610 Oil 0.610 Other 0.000 Non pumped storage hydro (NPSHYD) 0.000 Pump Storage (PS) 0.000 Wind 0.083 Electricity from France (INTFR) 0.699 Electricity from Ireland (INTIRL) |
Note above that the carbon emissions for coal powered power stations are almost three times those of closed cycle gas turbine power stations, and that carbon emissions from nuclear power stations are just 16g per unit compared to 910g per unit with coal.
Making the Calculation
The final calculation is very simple. For each fuel type multiply the percentage value by its conversion factor. Add together those results, and that gives the total CO2 released per unit of electricity generated. e.g. from the 3rd July sample data displayed earlier we get the following:
CCGT 0.407 (=40.7%) * 0.360 (= CCGT conversion factor) = 0.147
COAL 0.349 * 0.910 = 0.318
NUCLEAR 0.207 * 0.016 = 0.003
WIND 0.003 * 0.000 = 0
PS 0.007 * 0.000 = 0
NPSHYD 0.002 * 0.000 = 0
INTFR 0.025 * 0.083 = 0.002
…so the grand total was 0.147 + 0.318 + 0.003 + 0.002 = 0.47Kg per kWh = 470 grams of carbon dioxide released per unit of electricity generated at that time. This is the origin of the grams per unit figure displayed.
More Information
A document: Realtime Carbon Methodology (PDF) is available for download by clicking here. It includes plans for how they intend to improve the accuracy of their calculations in the future.