While most people have never heard of solar declination it is absolutely key to understanding PV solar generation and solar water heating potential over the course of a year.
The Earth’s Tilt and the Seasons
The Earth rotates around the Sun like a spinning top. Each time the Earth spins on its own axis (an imaginary line drawn through the North Pole and South Pole) is a ‘day’, and each full orbit of the Sun is a ‘year’. But, the spinning Earth tilts at an angle of 23.45° (2-3-4-5, so an easy number to remember!) relative to the path it follows around the Sun. It is this tilt which gives us on Earth its seasons.
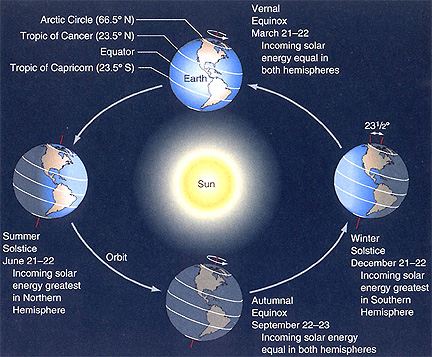
As the schematic from NASA above shows, when the northern hemisphere is tilted toward the Sun, it is summer in the north and winter in the south. Similarly, when the southern hemisphere is tilted toward the Sun, it is summer in the south and winter in the north.
Because of the tilt of the Earth, on the day of the summer solstice the Sun appears 23.45 degrees higher in the sky than it would if the Earth did not spin on a tilt, and on the day of the winter solstice the Sun appears 23.45 degrees lower in the sky than it would if the Earth did not spin on a tilt. Therefore the Sun appears approximately 47 degrees lower in the sky at noon on the winter solstice than it does at noon on the summer solstice.
As days are longer in the summer (the Sun spends more time above the horizon) AND the Sun gets higher in the sky during summer days (meaning it deposits more energy per square metre of the surface of the Earth in the hemisphere), temperatures in the summer are hotter than they are in the winter and more solar generation is possible in the summer than the winter.
Why does the Earth tilt on its own axis? It is believed that the early in its formation, the Earth was struck by another planet or large body, the remains of which may have became our moon. The angle of the collision and the size of the body (or bodies) which hit the Earth may have had a significant effect on its tilt and rotation speed (day length).
Solar Declination
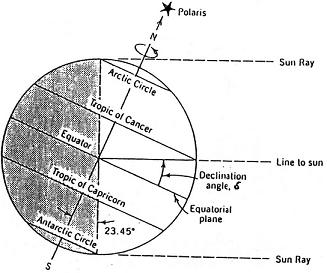
Solar declination is defined as “the angle between the Sun’s rays and the equatorial plane“. As we will show later in this article, the solar declination on any particular day of the year can be calculated, and that information together with your latitude can be used to calculate the solar elevation angle (the angle of the Sun above the horizon) at a given time on a given day in a given location – very useful for calculating how much power a solar panel in a particular geographical location can hope to generate (other factors permitting) and the ideal solar panel mounting angle.
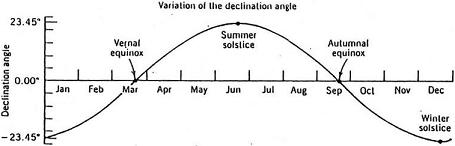
If a graph is drawn of solar declination against time through a whole year, the result is approximately a sine wave with an amplitude of 23.45 degrees. However, the Earth’s orbit around the Sun is not perfectly circular – it is actually elliptical. Because of this, the Sun moves more rapidly around the Sun in early January (perihelion – Earth closest to the Sun) than it does in early July (aphelion – Earth furthest from the Sun) and so changes in solar declination happen faster in January than they do in July. As perihelion and aphelion occur around a couple of weeks after the solstices, there is some asymmetry in what would otherwise be a sine wave.
Calculating Solar Declination
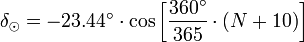
The equation above gives a rough estimation of the value of solar declination on a particular day, where N is the number of days which have elapsed since 00:01am on 1st January – i.e. for noon on the 1st January, N = 0, for noon on 2nd January, N = 1…etc.
This equation treats the Earth’s orbit as being round rather than its true elliptical shape along with some other approximations which render it inaccurate by as much as 2 degrees (4 times the width of the Sun) at some times during the year.
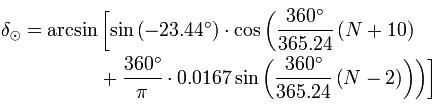
The equation above gives much more accurate values for solar declination throughout the year as it takes into account the eccentricity of the Earth’s orbit around the Sun and the true length of a year (365.24 days). The results given are accurate to within 0.2 degrees (and even greater accuracy can be obtained with a few modifications which are beyond this introductory article).
Table of Solar Declinations
Don’t worry, you do not need to get out your calculator. Below is a table of approximate solar declination values for every day of the year, calculated using the more accurate of the two solar declination calculation equations presented above.
Note that the values are given in decimal degrees – for example, +7.72° which is equivalent to +7°43′ (7 degrees and 43 minutes). A positive value means the Sun is north of the Earth’s equator, and a negative value means the Sun is South of the equator.
| Jan | Feb | Mar | Apr | May | Jun | Jul | Aug | Sep | Oct | Nov | Dec | |
| 1 | -23.08° | -17.38° | -7.97° | 4.15° | 14.77° | 21.91° | 23.18° | 18.28° | 8.66° | -2.79° | -14.11° | -21.65° |
| 2 | -23.00° | -17.10° | -7.59° | 4.53° | 15.07° | 22.05° | 23.11° | 18.03° | 8.30° | -3.18° | -14.43° | -21.81° |
| 3 | -22.91° | -16.81° | -7.21° | 4.92° | 15.37° | 22.18° | 23.04° | 17.78° | 7.94° | -3.57° | -14.75° | -21.96° |
| 4 | -22.82° | -16.52° | -6.83° | 5.30° | 15.67° | 22.31° | 22.96° | 17.52° | 7.57° | -3.95° | -15.07° | -22.10° |
| 5 | -22.72° | -16.22° | -6.44° | 5.69° | 15.96° | 22.43° | 22.88° | 17.26° | 7.20° | -4.34° | -15.38° | -22.24° |
| 6 | -22.61° | -15.92° | -6.06° | 6.07° | 16.25° | 22.54° | 22.79° | 16.99° | 6.83° | -4.73° | -15.68° | -22.37° |
| 7 | -22.49° | -15.62° | -5.67° | 6.45° | 16.53° | 22.65° | 22.69° | 16.72° | 6.46° | -5.11° | -15.99° | -22.49° |
| 8 | -22.37° | -15.31° | -5.28° | 6.82° | 16.81° | 22.75° | 22.59° | 16.44° | 6.09° | -5.50° | -16.28° | -22.61° |
| 9 | -22.24° | -14.99° | -4.89° | 7.20° | 17.08° | 22.84° | 22.48° | 16.16° | 5.71° | -5.88° | -16.58° | -22.72° |
| 10 | -22.10° | -14.67° | -4.50° | 7.57° | 17.35° | 22.93° | 22.36° | 15.87° | 5.33° | -6.26° | -16.86° | -22.82° |
| 11 | -21.95° | -14.35° | -4.11° | 7.94° | 17.62° | 23.01° | 22.24° | 15.58° | 4.95° | -6.64° | -17.15° | -22.91° |
| 12 | -21.80° | -14.02° | -3.72° | 8.31° | 17.88° | 23.08° | 22.11° | 15.29° | 4.57° | -7.02° | -17.43° | -23.00° |
| 13 | -21.64° | -13.69° | -3.33° | 8.68° | 18.13° | 23.15° | 21.98° | 14.99° | 4.19° | -7.39° | -17.70° | -23.08° |
| 14 | -21.47° | -13.36° | -2.93° | 9.04° | 18.38° | 23.21° | 21.84° | 14.69° | 3.81° | -7.77° | -17.97° | -23.15° |
| 15 | -21.30° | -13.02° | -2.54° | 9.40° | 18.62° | 23.26° | 21.69° | 14.38° | 3.43° | -8.14° | -18.23° | -23.21° |
| 16 | -21.12° | -12.68° | -2.14° | 9.76° | 18.86° | 23.31° | 21.53° | 14.07° | 3.04° | -8.51° | -18.49° | -23.27° |
| 17 | -20.93° | -12.33° | -1.75° | 10.12° | 19.10° | 23.35° | 21.37° | 13.76° | 2.66° | -8.88° | -18.74° | -23.32° |
| 18 | -20.74° | -11.99° | -1.35° | 10.47° | 19.32° | 23.38° | 21.21° | 13.44° | 2.27° | -9.25° | -18.99° | -23.36° |
| 19 | -20.54° | -11.63° | -0.96° | 10.82° | 19.55° | 23.40° | 21.04° | 13.12° | 1.88° | -9.62° | -19.23° | -23.39° |
| 20 | -20.33° | -11.28° | -0.56° | 11.17° | 19.76° | 23.42° | 20.86° | 12.79° | 1.50° | -9.98° | -19.47° | -23.41° |
| 21 | -20.12° | -10.92° | -0.17° | 11.51° | 19.97° | 23.43° | 20.67° | 12.47° | 1.11° | -10.34° | -19.70° | -23.43° |
| 22 | -19.90° | -10.56° | 0.23° | 11.85° | 20.18° | 23.44° | 20.48° | 12.13° | 0.72° | -10.70° | -19.92° | -23.44° |
| 23 | -19.67° | -10.20° | 0.62° | 12.19° | 20.38° | 23.44° | 20.29° | 11.80° | 0.33° | -11.05° | -20.14° | -23.44° |
| 24 | -19.44° | -9.83° | 1.02° | 12.53° | 20.57° | 23.43° | 20.09° | 11.46° | -0.06° | -11.41° | -20.35° | -23.43° |
| 25 | -19.20° | -9.47° | 1.41° | 12.86° | 20.76° | 23.41° | 19.88° | 11.12° | -0.45° | -11.75° | -20.55° | -23.42° |
| 26 | -18.96° | -9.09° | 1.80° | 13.19° | 20.95° | 23.39° | 19.67° | 10.78° | -0.84° | -12.10° | -20.75° | -23.40° |
| 27 | -18.71° | -8.72° | 2.20° | 13.51° | 21.12° | 23.36° | 19.45° | 10.43° | -1.23° | -12.44° | -20.94° | -23.37° |
| 28 | -18.46° | -8.35° | 2.59° | 13.83° | 21.29° | 23.32° | 19.23° | 10.08° | -1.62° | -12.78° | -21.13° | -23.33° |
| 29 | -18.19° | 2.98° | 14.15° | 21.46° | 23.28° | 19.00° | 9.73° | -2.01° | -13.12° | -21.31° | -23.28° | |
| 30 | -17.93° | 3.37° | 14.46° | 21.61° | 23.23° | 18.76° | 9.38° | -2.40° | -13.46° | -21.48° | -23.23° | |
| 31 | -17.66° | 3.76° | 21.77° | 18.53° | 9.02° | -13.79° | -23.17° |