Solar insolation (aka solar irradiation) is a measure of the amount of INcident SOlar RadiATION directly hitting a given surface area somewhere on the earth. Knowing the solar insolation value in your location gives you a way of estimating the amount of power a photovoltaic solar panel or solar water heating panel of a certain size and efficiency can generate during a year.
Over the course of a year, the average amount of solar radiation hitting a square metre of the top of the atmosphere is 1366 Watts. As these rays of sunlight pass through the atmosphere some energy is absorbed or reflected by the atmosphere so that by the time we get down to sea level, there is an average of 1000 Watts per square metre on a surface pointed directly at the sun when there are no clouds.
On its own this measure is not very useful for solar installers. What we need to know is the average total solar insolation over the course of a year taking into account prevailing weather conditions as some locations are cloudier than others, altitude – solar insolation is higher in locations above sea level since the sun’s rays have to pass through less atmosphere, latitude since the further from the equator you are the greater the projection effect (see Solar Panel Mounting Angle) and also the length of days, and other factors.
Solar insolation is not something that can be calculated, it is something which has to be measured, but fortunately meteorologists around the world have been collecting solar insolation data for decades and they have made solar insolation maps which give a good estimate of annual solar insolation for any location.
Solar Insolation Maps
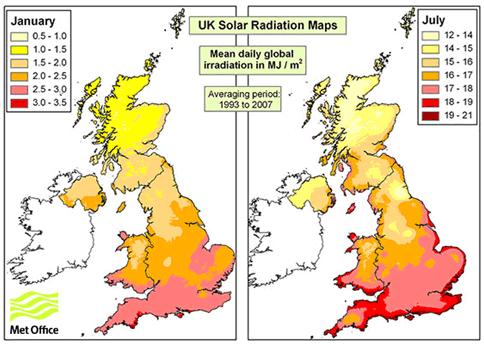
Above is a pair of UK Solar Radiation Maps. They show the average daily irradiation levels for all areas of the UK for January and July. Note how the level of irradiation is as much as 10 times greater in July than it is in January because of the effect of latitude, weather, and the length of days.
Of more use to a solar installer is the UK Solar Insolation Map below. This shows the amount of electricity that can be generated by an optimally positioned 1kW rated PV solar panel – for example in a yellow area such as Leeds, a 1kW solar panel should produce 825 kWh (units) of electricity in a typical year whereas the same panel in a brick red area such as Plymouth would produce around 950 kWh, and a panel in Aberdeen only 700 kWh.
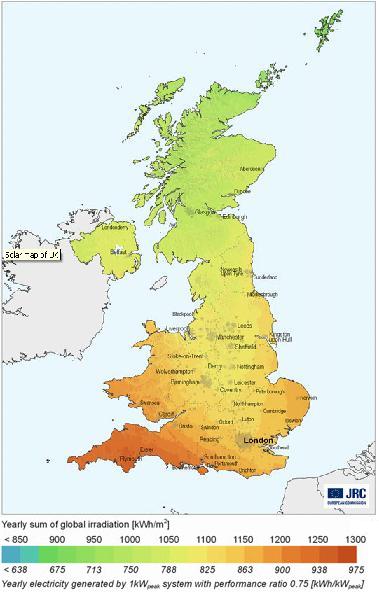
Using this information, we can see that if someone in Leeds wanted to generated 2000 kWh of electricity annually on average, they would need to install around 2400 Watts of solar panels since 2000 kWh / 825 kWh = 2.4kW.
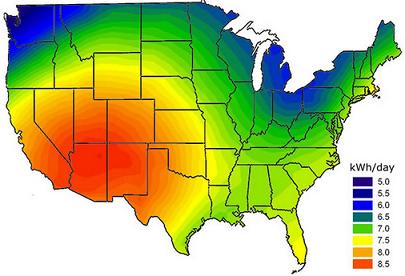
Pictured below is a solar insolation map for USA which shows the average amount of energy per square metre across the continental USA. Note how locations with the same latitude can have widely different solar insolation levels because of prevailing weather conditions and altitude – 20% more solar insolence in Southern Utah than in Kentucky for example.
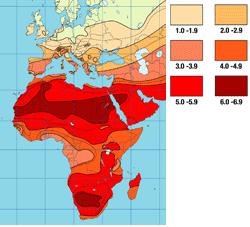
Finally, the map below shows solar insolation values for Europe, West Asia, and Africa. Note how the level of solar insolation in Saharan Africa is up to 7 times greater than that for Scotland in the UK, and at least 4-5 times greater than for the majority of locations in Northern and Central Europe. If it is for this reason that serious plans are being developed to power Europe from Sahara solar energy.