In order to calcalate the likely power output from a given wind turbine it is necessary to understand the wind in the planned turbine location. It is very easy to find the average wind speed in a location – for example using the UK Wind Speed Database – but that only paints half of the picture.
Wind speeds in most of the world can be modelled using the Weibull Distribution. This statistical tool tells us how often winds of different speeds will be seen at a location with a certain average (mean) wind speed. Knowing this helps us to choose a wind turbine with the optimal cut-in speed (the wind speed at which the turbine starts to generate usable power), and the cut-out speed (the speed at which the turbine hits the limit of its alternator and can no longer put out increased power output with further increases in wind speed).
Weibull Distribution and Wind Speeds

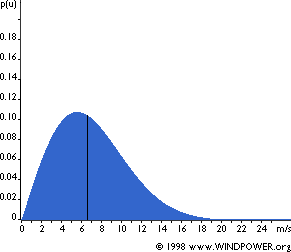
Pictured above is an example of the Weibull Distribution of Wind Speeds for a site with an average (mean) wind speed of 7 metres per second (from Danish Wind Industry Association). It demonstrates visually how low and moderate winds are very common, and that strong gales are relatively rare. The line at 6.6 metres per second marks the median wind speed. 50% of the time the wind is lower than the median and 50% of the time it is stronger than the median.
The shape of the Weibull Distribution depends on a parameter called (helpfully) Shape. In Northern Europe and most other locations around the world the value of Shape is approximetely 2. Standard performance figures provided by wind turbine manufacturers typically use a Shape value of 2 making this distribution a Rayleigh Distribution.
The higher the value of Shape (from 1 to 3) the higher the median wind speed – i.e. locations with lots of low wind speeds as well as some very strong winds would have a value of shape of below 2, locations with fairly consistent wind speeds around the median would have a shape value of 3.
Using the Weibull Distribution
Since the Weibull Distribution can be used to calculate the probability of a particular wind speed at a particular location, it can be used to work out the number of hours per year that certain wind speeds are likely to recorded and therefore the likely total power output of a wind turbine per year.
NEW Click here to use our new free Wind Turbine Electricity Output Calculator
Example Electricity Generation Calculation
We can calculate the power generated by a wind turbine at different wind speeds as long as we know the diameter of the turbine rotors, and the overall efficiency of the turbine generator (below the Betz Limit of 59%). Then we simply multiply the number of hours at each wind speed by the power generated at that wind speed to give us the number of Watt Hours of power generated – or divide by 1,000 to give us the number of kwh of power generated per year (1 year = 8,772 hours).
Looking at the Windsave 1000 – this domestic wind turbine has a rotor diameter of 1.75m, a cut-in speed of 5m/s, and a cut-out speed of 14m/s. Assuming an efficiency of around 35% and an average wind speed of 5 m/s (not actually realistic on most UK roofs – see our article on roof mounting wind turbines), the total electricity output is given by the Weibull Distribution at around 990 kWh per year.